
Estimating Lung Cancers
or,
It’s Perfectly Safe,
But Don’t Breathe Too Deeply
Part 1
Estimating Lung Cancer Deaths
Caused by Permissible Radon Exposures
in New Homes in Elliot Lake, Ontario
by Dr. Gordon Edwards
a summary of testimony presented to
the Ontario Environmental Assessment Panel
on permissible levels of radon contamination
for new homes in the town of Elliot Lake
TABLE OF CONTENTS
- List of Figures
- List of Exhibits
- Introduction
- Summary
- Forward
- Mathematical Models: Right or Wrong?
- The Problem of Extrapolation
- Living Systems versus Non-Living Systems
- The Linear Hypothesis and Alpha Radiation
- Mathematical Models of Radiation Carcinogenesis
- Cancers from Alpha Radiation at Low Doses: Experimental Results
- Cancers from Radon Gas at Low Levels: Epidemiological Results
- Ministry of Housing Data: Lung Cancer Deaths Caused by Radon
- Interpretation of MOH Estimates: Anticipated Lung Cancer Deaths
- Corrections to MOH Estimates: Probable Lung Cancer Deaths
- Comments on the Calculations
a) Non-Conservative Factors: More Deaths than Expected?
b) Conservative Factors: Fewer Deaths than Expected?- Violation of Control Board Guidelines
- Estimating the Health Risk from Gamma Radiation
- Conclusions and Recommendations
- Biographical Notes
- List of References
- Glossary
- Footnotes
LIST OF FIGURES
- Geometric Illustration: Problem of Extrapolation
- Biological Illustration: Problem of Extrapolation
- Models of Radiation Carcinogenesis at Low Doses
- Composite Models of Radiation Carcinogenesis
- Evidence on Alpha-Induced Tumors at Low Doses
- Graphical Summary of Gofman’s Calculations
LIST OF EXHIBITS
- Congressional Seminar: List of Participants
- Congressional Seminar: Excerpts
- “Radon Daughter Cancer in Man” — Abstract
- Lung Cancer Deaths in Colorado Miners: MOH Table 1
- Lung Cancer Deaths in Colorado Miners: MOH Table 2
- Lung Cancer Deaths from Czechoslovakia: MOH Table 3
- Lung Cancer Deaths from Hiroshima: MOH Table 4
- MOH Risk Estimates of Lung Cancer Deaths
- Lifetime Risk Estimates of Lung Cancer Deaths
- Corrected Risk Estimates of Lung Cancer Deaths
- “Radon Daughter Cancer in Man”: Table III
- Letter from K. Morgan to J. Schlesinger
INTRODUCTION [1978]
In the Spring of 1978, Ontario Hydro signed contracts with Denison Mines and Preston Mines to supply uranium for those nuclear reactors already operating, under construction, or firmly committed in the Province of Ontario. The value of these contracts may exceed $7 billion.As a result, the town of Elliot Lake is undergoing phenomenal expansion. Uranium production is expected to increase by a factor of about five over the next few years. Whole new subdivisions are springing up to accommodate the workers and their families. Unfortunately, many of these new homes are showing high levels of radon gas in their basements — presumably because of the natural radioactivity of the soil. This situation raises important questions of public health policy since radon gas is an extremely potent cancer-causing agent.
Mechanical aids have been incorporated into the architecture of the Elliot Lake homes in order to alleviate the problem. In some cases, pipes have been laid under the basement floor, and fans have been installed to blow most of the radon gas outside the house. In other cases, the basement floors and walls have been coated with a special sealant designed to prevent radon gas from getting into the house. However, the problem cannot be eliminated altogether, nor can it be controlled in a maintenance-free manner unless the homes are built without basements or in an altogether different location.
Recognizing the problem, the Province of Ontario has proposed a standard for an “acceptable level” of radon gas in newly built homes, following recommendations laid down by the Atomic Energy Control Board. In March of 1978, the Elliot Lake Environmental Assessment Board (which was established by an Order in Council to investigate the environmental implications of the proposed expansion plans) scheduled three days of special hearings in Elliot Lake to consider the question of radon gas in homes and the adequacy of the proposed government standards.
The present paper is a summary of the evidence which I presented to the Board on March 10 and 13 on behalf of the United Steelworkers of America. Using data supplied by the Ontario Ministry of Housing, I argued that a 31 percent increase in the male lung cancer rate could result if the presently proposed standard for radon gas in homes is adopted. On the basis of this testimony, the Board recommended that the Province re-evaluate the radon gas standard which they are proposing. However, there is no indication that such a re-evaluation is taking place. The expansion is proceeding at an undiminished rate, and new homes are being built according to the very standard which is under question. Apparently, public health has to take a back seat to economic expediency.
I was personally shocked to discover that the Elliot Lake Environmental Assessment Board had no funds to call independent medical experts to testify on the biomedical effects of radon inhalation. Instead, the Board had to rely on those experts brought in by the mining companies and by the United Steelworkers of America at their own expense. This is not conducive to a balanced perspective on an important public health matter, since the financial resources are heavily biased in favour of the industry.
The industry witnesses and the government witnesses all seemed to downplay the hazard to a remarkable extent. One witness who presented himself as an expert in cost benefit analysis argued that the 156 extra lung cancer deaths which one might expect over the next 30 years as a result of radon exposure in Elliot Lake were of no great consequence, because
- those people would have died anyway, from some other cause, if they hadn’t died of cancer;
- they would each die only one day sooner than they would have otherwise died, on the average (!!), and therefore,
- the cost of the lost person-days, for these 156 cancer deaths, calculated at a rate of $30,000 per year, would only be about $12,000.
The stupidity and callousness of this calculation did not escape the Board. However, it is a shame that better testimony was not available.
This little story, which can be found in the transcript of the Elliot Lake Hearings for March 13, 1978, provides a grim illustration of biopolitics at work. Biopolitics is the dubious art of justifying whatever economic decisions have been made by arguing that the biological effects will be negligible.
It is my belief that the public health will be protected only when society is prepared to err on the side of safety rather than on the side of expediency.
Gordon Edwards, Ph.D.,
June, 1978
SUMMARY
The Ontario Ministry of Housing, in cooperation with the Atomic Energy Control Board, is proposing a standard for an “acceptable” level of radon gas in homes and other buildings. According to data published by the Ministry, this proposal could result in a 31 percent increase in the incidence of lung cancer among the male occupants of such buildings. (Data on female risk figures is not available.)
What is radon and what does it do?
Radon is a naturally occurring radioactive gas. It is produced as an inevitable byproduct of the radioactive disintegration of uranium. Since uranium is found in small amounts almost everywhere on earth, radon gas is also found, in small amounts, almost everywhere. However, in places where uranium or its radioactive daughters are present in higher-than-usual concentrations, radon gas also occurs at higher concentrations — for example, wherever there is uranium or phosphate ore, or the “tailings” left over from mining and processing such ores.
Radon gas has a half-life of 3.8 days, whereupon it produces other radioactive substances (which are solids) known as “radon daughters”. These latter substances, the radon daughters, are mainly responsible for the high incidence of fatal lung cancer in uranium and other hard rock miners. The radon daughters attach themselves to microscopic dust particles, which are then inhaled down into the deepest parts of the lung. Radon is much more harmful in a confined area such as a mine shaft or basement, since the radon daughters then have a chance to build up to higher concentrations, and thus deliver a higher dose of ionizing radiation to the lungs when inhaled.
How does radon get into buildings?
In 1967, in Grand Junction (Colorado), it was discovered that thousands of homes and other buildings had been built on uranium tailings, leading to high radon gas levels in homes, schools, and workplaces. In 1975, many homes in Port Hope (Ontario) were found to be constructed with radioactively contaminated material, creating similar problems. In 1976, hundreds of homes in Elliot Lake (Ontario) were found to have high radon levels indoors, presumably because of the higher-than-usual amounts of uranium in the soil. In 1977, some homes in Newfoundland were found to have been constructed using radioactive slag from a phosphate plant, leading to excess levels of radon gas indoors.
Moreover, recent surveys have turned up “pockets” of homes having excess radon levels in almost every city in Canada. In all these cases, the inhabitants of such buildings are being exposed to radon levels which are much higher than average. The question is: since radon cannot be totally eliminated, what is an “acceptable level” in terms of public health policy?
What are the proposed standards?
The Ontario Ministry of Housing, following criteria established by the Atomic Energy Control Board of Canada, is suggesting the following standards:
- Radon Levels Inside Buildings (in working levels, WL)
- Prompt Remedial Action : over 0.15 WL
- Acceptable: under 0.02 WL
- Requiring Investigation: over 0.01 WL
- Gamma Radiation Inside Buildings (in millirems per hour)
- Prompt Remedial Action: over 0.10 millirem/hour;
- Acceptable: under 0.05 millirem/hour
(measured 1 metre above floor, centre of room)The proposed acceptable limit for radon gas in buildings, 0.02 working levels — 0.02 WL — is expected to cause some additional cases of lung cancer over and above the natural incidence of this usually fatal disease. The present paper deals with the question of how much additional lung cancer can be expected if a sizable population is exposed to such levels of radon in their homes, schools, and workplaces.
What are the expected public health consequences?
The Ministry of Housing does not expect that exposure to 0.02 WL of radon over a lifetime will cause more than a 5 percent increase in lung cancer among males. This conclusion is based on studies of uranium miners, most of whom suffered much higher exposures than those to be expected from radon gas in buildings.
However, recent scientific evidence from many countries indicates that at lower dose rates, radon is much more effective in causing cancer (per unit dose) than at higher dose rates. If this is so, then the official estimates of the health effects of living in a radon atmosphere of 0.02 WL are grossly understated, and we have the potential for a major public health tragedy. Some of this evidence is summarized in the ensuing paper, and the implications for public health are clearly explained.
Using only the data supplied by the Ontario Ministry of Housing to the Elliot Lake Environmental Assessment Board it is shown that continuous exposure to 0.02 WL for 12 hours per day could lead to a whopping 31 percent increase in the incidence of lung cancer for males. It is therefore concluded that the radon-in-housing standards have to be tightened up considerably.
F O R E W O R D (1985)
In March, 1978, there were three days of hearings by the Elliot Lake Environmental Assessment Board into the questlon of how much radon gas should be considered acceptable in new housing.
At the invitation of Homer Séguin of the United Steelworkers of America — the union that represents the Elliot Lake uranium miners — I attended the hearings and testified as a mathematician on the health risks of radon gas. Using the Ontario Governrent’s own published mortality figures, I pointed out that continuous exposure to the officially proposed level (for the maximum permissible dose of radon in new homes) would result in a 31 percent increase in lung cancer deaths among the exposed population.
At present, 54 out of every 1000 males in Ontario eventually die of lung cancer. A 31 percent increase in this mortality rate means an additional 16 lung cancer deaths per 1000, for a total of 70 per 1000 — a shocking increase in the incidence of an already shocking disease.
At the time, I had no way of knowing whether my concluslons would stand the test of time. I had simply accepted the government’s figures and used basic arithmetic to estimate the increase in lung cancer mortality. Nevetheless, the evidence I gave convinced the Assessment Board that a re-evaluation of the radon standard should be undertaken. A recommendation was made to that effect. It was ignored by both provincial and federal authorities.
In 1980, the British Columbia Medical Association published a 477-page book-length report entitled “The Health Dangers of Uranium Mining and Jurisdictional Questions”, written by two medical doctors: Eric Young and Robert Woollard. The authors, who carefully reviewed all available evidence from the leading medical authorities on the subject of radon hazards, fully confirmed my 1978 estimates. In fact, they estimated a 40 to 50 percent increase in lung cancer rates resulting from continuous exposure at the so-called “acceptable” level of radon exposures in homes.
The Canadian nuclear establishment, which had been assuring people for years that low levels of exposure to atomic radiation are perfectly harmless, was understandably upset by these unpleasant predictions. The Atornic Energy Control Board (AECB) refused to credit the BCMA risk estimates, and yet made no attempt whatsoever to discuss the medical evidence with the authors of the BCMA Report. Atomic Energy of Canada Limited (AECL) published an angry retort, and tried, without success, to get the BCMA to disassociate itself from the Report. Today, the BCMA still stands behind the integrity of the Young/Woollard Report.
Meanwhile, independent American scientific organizations — notably the National Academy of Sciences (NAS) and the National Institute of Occupational Safety and Health (NIOSH) — were arriving at conclusions very similar to those reached by the BCMA.
The National Academy’s 1980 BEIR-III Report reported risk estimates for lung cancer mortality caused by low levels of radon exposure which were fully consonant with the BCMA’s findings. That same year, a NIOSH Report called for a tightening of the standards governing permissible levels of radon exposure, citing the results of numerous studies which indicate that low levels of radon exposure may be much more harmful than was previously thought.
Against this background, the AECB’s Advisory Committee on Radiological Protection commissioned a study by Duncan Thomas of McGill University to review the existing medical evidence on radon hazards. Dr. Thomas, a trained epidemiologist, based his study on the numbers of recorded deaths from lung cancer among workers exposed to various levels of radon gas in Sweden, Czechoslovakia, Colorado, and Canada. Dr. Thomas’ report, the most careful study of its kind ever done in Canada, was published by the AECB in 1982. It estimates that continuous exposure to the maximum permissible level of radon in homes will likely result in a 37 percent increase in lung cancer deaths. (The Thomas report also estimates that continuous exposure of underground miners to the much larger maximum permissible level of radon in the mines will likely cause a three or four hundred percent increase in lung cancer deaths!)
Although the AECB published Dr. Thomas’ report, it has chosen to ignore it. In a slim thirteen page docunent published in 1982, the same Advisory Committee which commissioned Dr. Thomas’ report dismisses it with scarcely a word of explanation. No reason is given, except that it doesn’t “jibe” with the findings of various pro-nuclear bodies (such as the ICRP — the International Commisslon on Radiological Protection) which the AECB prefers to place its trust in. Neither the Advisory Committee nor the AECB has prepared any critique of Dr. Thomas’ work, nor have they identified any mistakes in his methodology. They just don’t like his findings.
The reason for their dislike became clear when, in November of 1983, AECB announced plans to completely change the existing regulations governing radiation standards. Under the new proposed régime, various vital organs in both atomic workers and members of the Canadian public could be exposed to considerably larger doses of radiation than are currently permitted. In particular, the maximum permissible exposure to radon gas could be increased by about 20 percent.
Because of an unprecedented storm of opposition from all of the major unions representing Canada’s 100,000 atomic workers — including uranium miners, reactor operators, and those who handle radio-isotopes — AECB has temporarily withdrawn its proposed new regulations on radiation standards. As of August 15 1985, no further effort has been made by AECB to relax the existing radiation standards. But the situation may change at any time.
Radioactive pollution should be a matter of concern for all Canadians. Although this report deals only with lung cancer caused by radon gas I hope it is of some use in awakening other Canadians to the dangers we all face in an increasingly radioactive world.
Gordon Edwards, Ph.D.,
Professor of Mathematics,
Vanier College, Montreal,
August 15 1985
E S T I M A T I N G L U N G C A N C E R S
or,“I T ‘ S PERFECTLY SAFE , BUT DON ‘ T BREATHE TOO DEEPLY”
by Dr. Gordon Edwards
MATHEMATICAL MODELS: RIGHT OR WRONG?
A mathematical model is a description of reality using mathematical language. Such a description or model can be simple (like a graph) or complicated (like a computer simulation). It is quite possible for such a description to be wrong, in that it does not give correct results when applied to reality, even though the internal mathematical logic is impeccably correct.
A very simple illustration of this principle can be provided using a familiar geometric example. It was once thought that the earth was flat — not an unreasonable assumption, since the earth looks flat. “Geo-metry” literally means “earth measurement”, and in ancient days it was believed that the results of elementary plane geometry accurately indicate what happens on the surface of the earth.
On a flat surface, two perpendiculars drawn from the same line will never intersect, no matter how far they may be extended (see Figure 1). But of course we now know that the earth is round, not flat, and so this conclusion about perpendiculars is wrong if it is applied to the surface of the earth. In fact, two perpendiculars drawn from the equator will intersect at the North Pole! [1]
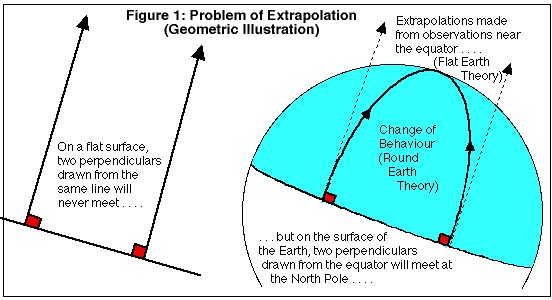
The fault is not in the mathematics; the fault is not in reality; the fault is in the mathematical model — in other words the mathematical description of reality is not entirely correct.
THE PROBLEM OF EXTRAPOLATIONThe previous example illustrates a general problem in mathematical modeling, which is the problem of extrapolating from known results to unknown regions. The ancients who developed the principles of elementary geometry lived in a limited region of the earth (near the Mediterranean), and in that region the geometrical principle seemed to be true that two perpendiculars drawn from the same line do not intersect. The ancient thinkers had no way of knowing that the behaviour of the two lines would change thousands of miles away from where they started, and that the two lines would eventually intersect (if drawn on the surface of the earth) some 6,000 miles later!
Another simple example, drawn this time from the field of biology, may clarify the problem of extrapolation still further. If a new species is introduced into an ecosystem, it spreads very rapidly, following an “exponential growth law” (see Figure 2). But this kind of rapid, accelerating growth cannot continue forever, and eventually, as the population grows, a leveling-off takes place as a result of new, previously unimportant factors — competition for food, competition for nesting sites, increase of predators — causing a marked change of behaviour. This change of behaviour would not be predicted by extrapolating from the initial observations made while the new species was still “young” [2]
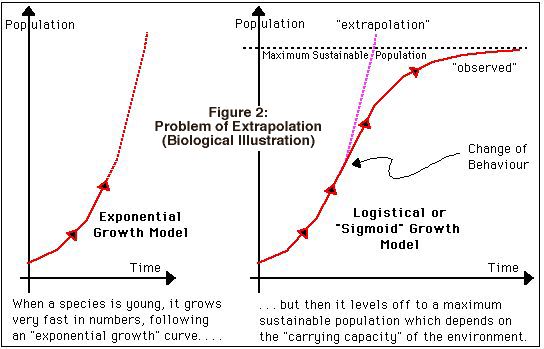
(Neither of these models applies to the growth of a single organism. It is true that if we all continued to grow as rapidly as children grow, we would be gargantuan in size by the time we become middle-aged; however, in that case the diminishing growth rate can be observed even at the earliest stages, unlike the population models used here, where the growth rate initially increases — the population grows faster as it gets bigger.)
The two examples just given reveal how, if the mathematical model is wrong, there can be a very pronounced divergence between the expected results (results predicted by extrapolating from the model) and observed results (what actually happens in reality).
LIVING SYSTEMS VERSUS NON-LIVING SYSTEMS
Living systems are more complicated in their behaviour than non-living systems, and consequently they are harder to describe. For this reason, mathematical models have been much less successful in the biological and social sciences than they have been in the physical sciences.
In carefully engineered systems, a great many predictive mathematical models have been developed to a very high degree of precision and sophistication and there is a high degree of reliability in the accuracy of most of those models (even though they are sometimes found to be wrong).
In the biological and social sciences, this is by no means the case. Due to the complexity of living systems, the capacity for error is enormous, and the mathematical models which are used are wrong more often than not. [3]
This point was brought home to me very strongly when I worked for the Science Council of Canada as the Assistant Director of a nation-wide study of the role of the Mathematical Sciences in Canada. The study examined the uses of mathematical modeling techniques in science, business, governments and industry, and concluded when living systems are involved that mathematical methods are very frequently misused, that mathematical models are very frequently in error, and that an undue reliance is placed in these models due to a lack of understanding of the problem of extrapolation.
Ample evidence to this effect can be found in a volume entitled “MATHEMATICS IN TODAY’S WORLD”, edited by myself and published by the Science Council of Canada, which contains the Proceedings of three one-day seminars held in Ottawa in 1974 dealing with:
- Mathematics and Policy Planning (March 4)
- Mathematics, Statistics, and the Environment (March 5)
- Mathematics, Science, and Technology (March 6)
Copies of these proceedings have been deposited in all university libraries in Canada.[4]
The use of mathematical models to describe living systems is still in its infancy, and there is much to be learned. In the meantime, extreme caution must be used in applying such models to real life situations.
THE LINEAR HYPOTHESIS AND ALPHA RADIATION
There is no doubt that exposure to radon gas and radon daughters causes lung cancer, at least for sufficiently high exposures. [5] This has been well established by studying the incidence of lung cancer in uranium miners and other hard rock miners. However, the precise nature of the relationship between lung cancer and radon exposure is extremely complicated, due to problems of measurement, lack of knowledge of the precise mix of radon daughters, the aggravating effect of dust, numerous biological factors affecting the latency period, synergistic effects with smoking and diesel fumes, and statistical uncertainties due to spontaneous fluctuations in the incidence of lung cancer. These complications are all well recognized (see for example the Ham Commission Report on the Health and Safety of Workers in Mines).
In the early days, it was hoped that there was a “safe threshold” — that is, a level of exposure to radon gas and its daughters below which no harm would be done and no extra lung cancers would be expected. However, experience has not supported the existence of such a safe threshold and no regulatory body in the world assumes that there is such a threshold. (Incidentally, this same “no threshold” principle seems to apply also to cancer-causing agents other than radioactivity).[6]
There has been a great deal of good scientific evidence brought forward over the years to support the so-called “linear hypothesis” as a generally conservative principle for estimating the number of cancers produced by a given dose of radiation; this “linear hypothesis” has been adopted by Canadian regulatory bodies as a basis for estimating such health effects. The linear hypothesis states that the number of excess cancers per unit exposure is always the same, no matter what the total dose of radiation is and no matter whether the dose is delivered slowly or quickly. In other words, the number of excess cancers is proportional to the sum total of all the doses administered to the population. [7]
This linear hypothesis is the mathematical model which has been used in the Ontario Ministry of Housing Report — the “MOH Report” — to estimate the number of excess lung cancers that might be expected as a result of radon exposure in homes in Elliot Lake. It is also the model which has been espoused by the Atomic Energy Control Board as a (hopefully) “conservative” model — which means that the model (hopefully) overestimates rather than underestimates the actual numbers of lung cancers that would be expected at low doses.
In the case of x-rays, gamma rays, and beta rays, there is a wealth of experimental evidence published in the scientific literature which supports the contention that the linear hypothesis is conservative when extrapolations are made from high doses to low doses. To my knowledge, however, there is no such evidence published relating to low doses of alpha radiation, especially in the case of alpha radiation to the lungs. [8] Rather, as we shall see, there is much evidence pointing to the opposite conclusion.
There are basically only two reasons for assuming that the linear hypothesis is conservative in estimating lung cancers at low doses of radon exposure:
- at high exposures the epidemiological evidence from miners exposed to radon is reasonably consistent with the linear hypothesis;
- for other types of radiation (other than alpha radiation) and various types of cancer (including lung cancer) the linear hypothesis seems to be conservative at low exposures.
But, in extrapolating from high doses to low doses of alpha radiation we encounter the classical problem of extrapolation of mathematical models from known results into unknown regions.
MATHEMATICAL MODELS OF RADIATION CARCINOGENESIS
On May 4 1976, at a Congressional Seminar on Low Level Ionizing Radiation held in Washington, D.C., the Chairman, Dr. Karl Morgan, [9] stated that the number of cancers (R = response) resulting from a given exposure to radiation (D = dose) seems to follow the mathematical relationship
R = c D n (where c and n are constants which depend on the type of radiation and the organ exposed)Exhibits 1 and 2 on the following pages provide some additional information about the Congressional Seminar.
EXHIBIT 1
Congressional Seminar on Low Level Ionizing Radiation
– May 4 1976 –List of Participants
Karl Z. Morgan, Professor of Health Physics, Georgia Institute of Technology, CHAIRPERSON.
John T. Edsall, Professor Emeritus of Biochemistry, Harvard University
Irwin Bross, Director of Biostatistics, Roswell Park Memorial Institute for Cancer Research, Buffalo.
Rosalie Bertell, Research Associate, Roswell Park Memorial Institute for Cancer Research, Buffalo.
Victor Archer, Medical Director of U.S. Public Health Services, National Institute for Occupational Safety and Health, Salt Lake City, Utah.
Seymour Jablon, Associate Director, Medical Follow-up Agency of the National Research Council; Staff Officer, radiation Effects Research Foundation; formerly Chief of Epidemiology, Atomic Bomb Casualty Commission.
Edward Martell, National Center for Atmospheric Research, Boulder, Colorado; formerly Advisor on High Altitude Fallout, Strategic Air Command.
Victor Bond, Associate Director in Life Sciences, Brookhaven National Laboratory; formerly on the National Academy of Sciences Advisory Committee on the Biological Effects of Ionizing Radiation.
Ernest Sternglass, Professor of Radiology, University of Pittsburgh.
Charles Richmond, Associate Director, Biomedical and Environmental Sciences, Oak Ridge National Laboratory.
William Ellen, Criteria and Standards Division, Environmental Protection Agency, Office of Radiation Programs.
Bernard Shleien, Office of Medical Affairs of the Bureau of Radiological Health, Food and Drug Administration.
Mark Barnett, Associate Director, Division of Training and Medical Applications, Bureau of Radiological Health.
Roger Mattson, Director, Division of Siting, Health, and Safeguards Standards, Nuclear Regulatory Commission.
Helen Caldicott, Researcher in Cystic Fibrosis, Boston Clinic; formerly Director of Cystic Fibrosis Research, Adelaide Children’s Hospital, Adelaide. Australia.
In addition, there were several representatives from the trade union movement.Among the invited participants who could not attend were John Gofman, Professor Emeritus of Medical Physics, University of California at Berkeley; and Bernard Cohen, Director, Nuclear Physics Laboratory, University of Pittsburgh.
The conference met at 9:35 a.m. on May 4 1976 in room 1202, Dirksen Senate Office Building, with Senator Gary Hart presiding.
EXHIBIT 2
Congressional Seminar on Low Level Ionizing Radiation
– May 4 1976 –
Excerpts from the Proceedings
Chapter IV
Dose-Response Relationships
— Linear or Non-Linear?Dr. Morgan:Let us go on to the next question.
Question 3: Do these effects that we are talking about increase linearly with increasing dose?
I believe data suggests that the cancer risk can, in a simple way, be expressed as an equation such as R (the risks) equals a constant c , times the accumulated dose D raised to some power n . In other words, R = c D n.
In the case of low-LET radiation — for example, x- , gamma– , and beta-radiation — the accumulated dose D must be corrected for repair of damage over time, as pointed out by Dr. Bond, in which it does appear in most cases that n is equal to or greater than 1 , suggesting the greater efficiency of multiple hits.
Dr. Baum (J. Baum, Health Physics Society, Houston, Texas, 1974) and many others have shown that, in the case of human exposure to radium, the best curve fit for cancer induction is when n is equal to 1/2 . Thus, for high-LET radiations, such as those from plutonium-239, the linear hypothesis underestimates the risk.
In a recent paper, I gave five reasons why the linear hypothesis as now applied is non-conservative. I might summarize as follows:
- Extrapolations are often made to zero of effects on animals and man, and they are sometimes extrapolated from the high dose descending portion of the parabolic curve where there would be overkill.
- Estimates are made from exposures to animals of short life span, and for a man (as pointed out in the BEIR Report) out to only about twenty years. Of course, other data over the remainder of man’s life would have to increase the slopes of these curves or the risks per rem .
- A uniform population is usually assumed, taking little account of the age distribution and the disease patterns, as Dr. Bross has pointed out.
- There is cell sterilization at the higher doses, and so it is somewhat risky to extrapolate from these doses because you would underestimate the risk at low doses.
- I think quite important is the fact that the recent data from Drs. C. W. Mays and H. Speiss on radium-224, a bone seeker like plutonium and other actinide elements, indicate that the cancer risk increases with protraction of the dose. This is just the opposite of what we have observed from low-LET radiation.
In summary, I would state that it is my opinion that the linear hypothesis is always non-conservative for high-LET radiation. Usually it is non-conservative for in-utero exposure of children to low-LET or high-LET radiations, but in some cases of adult exposure, it is probably conservative for low-LET radiation.
I am sure I have provoked a lot of discussion. Dr. Sternglass?
Dr. Sternglass:I would like to say that at the recent hearings by the EPA on radiation standards for the nuclear fuel cycles, I presented evidence, obtained by many people in the literature, that at the very low dose rates that we are talking about, we are dealing predominantly with a different biological mechanism than we are dealing with at the high dose rates.The recent data by Dr. Petkau show that as the dose rate decreases, it takes less and less dose to break a cell membrane. This evidence was not available at the time of the BEIR Report.
What it means is simply this, that for somatic — not genetic — situations, we are now faced with a whole new problem, namely the fact that when cell membranes are injured as a result of indirect chemical effects, the data of Dr. Petkau — both for free membranes and his new data on micro-organisms and mice — show clearly that the lower the dose rate is, the less it takes to break a membrane.
As a result, one is led to a non-linear effect at low doses, which is opposite to what we had expected in the past. In fact, the curve of response versus dose goes up much more rapidly at the origin, to the degree that this leads to an under-estimate of biological effects of very low doses using a linear extrapolation, of something like a few hundred, possibly as much as a thousand-fold.
Now recent studies have shown that membranes are involved in the functioning of the immune system of the body. One of the most important things about the immune system is that it not only defends the body against viruses and bacteria, but we now know from recent evidence published in the last few years, that the immune system also detects and controls cancer cells.
Thus, we are now faced with the evidence that cell membrane damage is possibly the controlling one in cancer induction at low dose rates, while at high dose rates, the controlling process seems to be direct damage to the DNA.
This means that we now have a mechanism that we did not have before that can explain not only the very large increases in infant mortality, but also the changes in heart disease and cancer all over the world following the period of (atmospheric) nuclear testing.
NOTESFor definition of terms, see the glossary.
For explanation of R = c D n , see Figure 3.For more information, see:
“Suggested Reduction of Permissible Exposure to Plutonium and
Other Transuranium Elements”, American Industrial Hygiene
Association Journal, v. 36, Aug. 1975, 567-575, by Karl Z. Morgan.
Most mathematical models proposed to explain the carcinogenic nature of radiation at low doses do follow the equation described above —
R = c D n except those models which assume a “safe threshold”. The latter are quite unfashionable at the present time — as stated by Dr. Howard Newcombe, a radiation biologist employed by AECL, during cross-examination at the Porter Commission on Electric Power Planning on January 19, 1978. [10]
- If n = 1, the above equation produces a straight line graph which corresponds to the linear hypothesis (see Figure 3).
- If n is greater than 1, the equation corresponds to a graph which “scoops upward” and in this case the linear hypothesis would be conservative — it would overestimate the number of deaths actually produced by low doses of radiation.
- However, if n is smaller than 1, the equation corresponds to a graph which “scoops downward” and in this case the linear hypothesis would be non-conservative — it would tend to underestimate the number of deaths actually produced by low doses of radiation.
FIGURE 3:
Models of Radiation Carcinogenesis at Low Doses
The general formula is R = c D n , where R = response = number of tumours, c = constant of proportionality, D = accumulated dose of radiation, and n = constant exponent. (Proceedings, page 20)
For the sake of completeness, it should be noted that some of the mathematical models proposed to explain radiation carcinogenesis are composites of two of these three cases. For example, some have suggested that for external irradiation, n = 2 might be appropriate for low doses and n = 1 might be appropriate for high doses, yielding a parabolic upward-bending curve with a “linear tail” (see Figure 4). On the other hand, if n = 1/2 were appropriate for low doses and n = 1 for high doses, you would have a downward-bending parabola with a linear tail (see Figure 4, below).
FIGURE 4:
Composite Models of Radiation CarcinognesisThe first composite would make the linear hypothesis conservative, while the second composite would make the linear hypothesis non-conservative at low doses.
ALPHA RADIATION AT LOW DOSES: EXPERIMENTAL RESULTS
In order to test the linear hypothesis at low doses of alpha radiation, additional data is needed to see if extrapolation from high doses is appropriate or not. It has long been recognized that alpha radiation poses a different kind of radiation hazard than X-rays, gamma rays, or beta rays.
- For one thing, alpha radiation has very little penetrating power (it cannot penetrate a sheet of paper) and so it is not a hazard unless alpha-emitting substances are ingested or inhaled into the body, and then the exact distribution of such substances within the body is not completely known. [11]
- Moreover, low doses of alpha radiation are usually delivered slowly over a period of time. This fact makes it very difficult to measure the exact accumulated dose of alpha radiation that is delivered to living tissues, especially when the dose is small. [12]
- It is also well known that alpha radiation is extraordinarily effective in causing cancer — so much so that a given amount of alpha radiation is about 20 times as effective as the same amount of X-radiation, gamma radiation, or beta radiation in causing cancer. That is why Dr. Muller uses a “quality factor” of 20 for alpha radiation (p. 5, line 1, Appendix MOH Report) and a “quality factor” of 1 for gamma radiation (p.6, bottom line, Appendix MOH Report). [13]
Until recent years, there has been almost no data published in the scientific journals dealing explicitly with the cancer-causing ability of alpha radiation at low doses. (As indicated on page 5 of the MOH Report, with an erroneous conclusion that this lack of evidence establishes conservatism). [19] In the last five years, however, numerous papers have appeared which indicate that at low doses, the linear hypothesis may seriously underestimate the cancer risk from alpha radiation.[14]
These results are discussed in the Proceedings of a Congressional Seminar on Low Level Ionizing Radiation (for a sample of the text, see Exhibit 2). As already noted, the Congressional Seminar was held on May 4, 1976 under the chairmanship of Dr. Karl Morgan, a very prominent and well respected figure in the field of Health Physics. The other participants in the seminar are listed in Exhibit 1. (For background information on Dr. Morgan, Dr. Archer, Dr. Gofman, and other scientists referred to in this paper, see the Biographical Notes)
According to the Introduction to the Proceedings:
“The meeting was aimed at informing Congressional members and their staff of recent evidence indicating greater than expected health effects from low dose rates of ionizing radiation. . . . Central to the discussion was the contention that the established method of calculating dose effects from ionizing radiation is nonconservative.” [15]
The evidence presented on low level alpha radiation is summarized graphically in Figure 5. It clearly suggests that at low doses, the linear hypothesis is non-conservative for alpha radiation.
FIGURE 5:
Evidence on Alpha-Induced Tumours at Low DosesThe evidence given here, reproduced from the Proceedings of the Congressional Seminar on Low-Level Ionizing Radiation, indicates that alpha radiation is more effective in producing cancer (per unit dose) at low doses than it is at high doses — unlike x-rays, gamma rays, and beta rays.
There may be published evidence in the scientific literature dealing with low level alpha radiation which would suggest a different conclusion. I am unaware of any such evidence, however. On January 19, 1978, I cross-examined Dr. Howard Newcombe of AECL (Atomic Energy of Canada Limited) on this subject at the Royal Commission on Electric Power Planning in Toronto, and he was unable to cite any evidence of a contrary nature. [16] Dr. Newcombe is one of the best known radiation biologists in Canada. He is currently a member of the International Commission on Radiological Protection and has served on the Advisory Committee on the Biological Effects of Ionizing Radiation for the U.S. National Academy of Sciences.
RADON EXPOSURE AT LOW DOSES: EPIDEMIOLOGICAL RESULTSAll epidemiological evidence dealing with lung cancers resulting from radon exposure points away from the existence of a “safe threshold”, and towards the conclusion that the linear hypothesis is non-conservative at low doses. Regarding the concept of a safe threshold, the Ham Commission concluded:
“Since the Commission’s Study of data based on the Ontario Uranium Nominal Roll provides no evidence supporting the hypothesis of a threshold of exposure below which there is not significant excess risk, the concept of a maximum safe exposure is not tenable on the basis of these data.” (p.95, Ham Commission Report)
Dr. Victor Archer, M.D., Medical Director of the U.S. National Institute for Occupational Safety and Health (NIOSH), has recently reviewed the epidemiological evidence for fifteen different groups of uranium miners, and has concluded that the linear hypothesis seriously underestimates the risk of cancer at low doses in every single case. In other words, the existing epidemiological evidence on uranium miners fully supports the evidence mentioned earlier about alpha-induced cancer at low doses. Dr. Archer has only reached this conclusion in the last two or three years, although he has twenty years experience in the field of lung cancer epidemiology for uranium miners. [17] (Archer et al., ref. 3; see exhibit 3 below)
EXHIBIT 3
A B S T R A C T
Archer, V.E., Radford, E.P., and Axelson, O. Radon Daughter Cancer in Man: Factors in Exposure-response Relationships. Radiation Research — to appear.Lung cancer among fifteen different mining groups exposed to radiation from radon daughters was analyzed to determine what factors influence incidence and induction latent period. As the exposure rate decreases, cancers per unit of radiation increases. The induction-latent period is shortened by increased age at start of mining, by cigarette smoking, and by high exposure rates. For follow-up periods of 20-25 years, the incidence increases with age at start of mining, with magnitude of exposure, and with amount of cigarette smoking. For very long follow-up periods, the incidence among nonsmokers sometimes exceeds that among smokers. Both lung cancers per year per WLM and relative risk were found to vary greatly with exposure rate, age of cohort at start of mining and with length of follow-up period. Lifetime risk per WLM, adjusted for exposure rate, was proposed as the best statistic for use in predicting lung cancers among other groups exposed to radon daughters. These findings are consistent with the theory of radiation carcinogenesis which postulates that cancer is caused by a series of changes in chromosomal proteins (some of which occur with increasing age) followed by a promoting factor.
Key words: Radiation, radon daughters, miners, lung cancer, carcinogenesis. In fact the epidemiological evidence has always been there, but until recently it was ignored because it did not conform to the linear hypothesis. In 1970, for example, Gofman and Tamplin published a paper reviewing the evidence of lung cancer incidence among uranium and hard rock miners who began working on the Colorado Plateau before 1955. Dr. Gofman’s arithmetic, using data provided by the U.S. Federal Radiation Council, clearly demonstrated the increasing effectiveness of radon exposure at low doses in causing lung cancer. His calculations are graphically presented in Figure 6 (based on reference 4). [18]
FIGURE 6:
Graphical Summary of Dr. John Gofman’s Calculations (Reference 4)
The radiation dose required to double the natural incidence of cancer is called a “doubling dose”. For uranium miners on the Colorado Plateau, Gofman’s evidence shows that — to double the incidence of radon-induced lung cancers — fewer accumulated WLM are required in the lower exposure categories than in the higher exposure categories.
A: miners exposed to less than 120 WLM (4 cancers)
B: miners exposed to less than 359 WLM (11 cancers)
C: miners exposed to less than 839 WLM (16 cancers)
D: miners exposed to less than 1799 WLM (27 cancers)
E: miners exposed to less than 3719 WLM (37 cancers)
F: total population of 1981 miners with 49 lung cancers
Category A is of dubious significance because of so few cancers.
Category B was corrected for possible additional radon exposure due to previous hard rock mining experience.
MINISTRY OF HOUSING DATA: Lung Cancer Deaths Caused by Radon
Let us now turn to the data supplied by Dr. Muller in the MOH Report. An examination of Dr. Muller’s first four tables — reproduced here — confirms Dr. Archer’s observations and Dr. Gofman’s conclusions: in each case, the greatest risk (per unit dose) occurs at the lowest exposures.
In each table, the first and last columns are the important ones to look at;
- the first column gives the degree of exposure to radiation, and
- the last column gives the number of radiation-caused cancers expected per unit dose at that exposure level.
In Table 1 (Exhibit 4) and in Table 2 (exhibit 5), both dealing with the Colorado Plateau data, a marked increase in excess cancers per WLM is observed at exposures below 359 WLM (Gofman’s categories A and B).
The last column of Table 2 tells the story:
- the average of the last four entries in this column is 5.25 excess cancers per WLM, but
- the second entry shows that the number of excess cancers per WLM is almost three times larger for exposures between 120 and 359 WLM, and
- the first entry shows that the cancer risk is almost six times larger for exposures between 0 and 120 WLM!
- The overall average risk of 5.7 excess lung cancers per WLM (given at the bottom of the last column of Table 2) greatly underestimates the risk for those exposed to less than 120 WLM (given at the top of the last column of Table 2).
Similar observations can be made about Table 3 (Exhibit 6) dealing with Czechoslovakian data.
- Notice first of all that the exposures in this table are in the range from 0 to 600 WLM for the most part, corresponding to only the first two or three entries in Table 2. In other words, the Czechoslovakian miners received considerably less exposure to radiation than the American miners.
- And, sure enough, the average risk of 11 excess lung cancers per WLM in Table 3 is twice the average of 5.7 from Table 2, thus confirming once more that lower exposures correspond to larger risks per unit dose.
- Moreover, within Table 3 itself, the number of excess cancers for exposures below 50 WLM is twice the average number of excess cancers from 50 WLM to 600 WLM, in full agreement with the doubling indicated between the first two entries of Table 2.
- Once again, in Table 3, the overall average of 11 excess cancers per WLM seriously underestimates the risk for those with low exposures (in this case, those with less than 50 WLM).
The same relationships can be observed in Table 4 (exhibit 7) which is based on data from Hiroshima. Using the correspondence 1 WLM = 4 rem to the lungs (which is even more establishment-oriented than Dr. Muller’s conversion factor — 1 WLM = 4.42 rem — given on page 5 of Appendix 1 of the MOH Report), we see that
- the first two entries in Table 4 fall in the “below 50 WLM” range;
- the second two entries lie between 50 and 300 WLM (equivalent) exposure;
- the average of the first two entries (4.5 excess cancers per rem) is triple the average of the last two entries (1.5 excess lung cancers per rem);
- the first entry (7 excess cancers per rem) is four times as large as the average of the other three entries (1.7 excess cancers per rem).
Thus, the Ministry of Housing data, assembled by Dr. Muller, is entirely consistent with the evidence cited earlier which suggests that the linear hypothesis seriously underestimates the risk of lung cancer at low exposures to radon. In fact, the relative risk seems to get consistently worse as the exposures get progressively smaller
All of this evidence points away from a safe threshold and away from the linear hypothesis, contrary to what is stated on page 5 of the MOH Report. [19]
INTERPRETATION OF MOH ESTIMATES: Anticipated Lung Cancer Deaths
The Ministry of Housing is recommending a standard of 0.02 WL of radon in buildings. If one were to spend one’s lifetime in such a building, what would be the risk of getting lung cancer as a result of this radon exposure?
Table 6 from the MOH Report, reproduced below, summarizes the Ontario government’s risk estimates for a lifetime exposure at 0.02 WL of radon at the rate of one hour’s exposure per day. These are based on the average cancer risk values presented in Table 1, Table 2, Table 3, and Table 4, with some additional assumptions. As the MOH Report explains, “increasing or decreasing the hours of exposure per day will increase or decrease the risk (as given in Table 6 below) by the same factor.” (MOH Appendix, page 6)
EXHIBIT 8:
ONTARIO MINISTRY OF HOUSING TABLE 6
Effects of Exposure to 0.02 WL for one hour per day over a lifetime
Study
PopulationModel Used Number of Radiation-Induced
Cancers per 100,000 PersonsMean Loss of Life Expectancy at birth, per person (days) Male Female Male Female Colorado
Plateau
Uranium
MinersAbsolute Risk Model 12 15 1.4 2.0 Relative Risk Model 12 15 1.3 0.45 Uranium Miners
in CzechoslovakiaRelative Risk Model 53 13 2.4 0.85 Hiroshima Relative Risk Model 50 12 2.3 0.80 ICRP 25 31 3.1 4.1
We will limit ourselves to the male risk figures in Table 6, since almost all of the epidemiological evidence is based on male populations, and it is not clear how the female figures are arrived at. [20] As the MOH Report refers to “the fact that people spend no more than half their time outdoors during the course of a year” (accompanying the Summary of Clean-up Criteria in the Appendix), let us assume a minimum of 12 hours per day exposure indoors. We then arrive at the following risk figures for males (making use of Table 6 and the natural incidence of lung cancer in Ontario males of 54 per 1000, given in the MOH Report.)
EXHIBIT 9:
ESTIMATES OF MALE LUNG CANCER RISK
FROM A LIFETIME EXPOSURE TO 0.02 WL
Source of
InformationExtra Cancers
per 100,000 men
(1 hour/day)Extra Cancers
per 100,000 men
(12 hours/day)Extra Cancers
per 100,000 men
(17 hours/day)Increase in
Cancer Rate
(12 hours/day)Increase in
Cancer Rate
(17 hours/day)Minimum Risk
from Table 612 144 204 2.7 percent 3.8 percent Muller’s Estimate
(Appendix, p. 91)20 240 340 4.4 percent 6.3 percent I.C.R.P.
from Table 625 300 425 5.6 percent 7.9 percent Overall Average
from Table 633.6 403 571 7.5 percent 10.6 percent Relative Risk
Data (averaged)47 564 799 10.4 percent 14.8 percent Maximum Risk
from Table 653 636 901 11.8 percent 16.7 percent
A glance at the right hand column shows that there is a very wide spread in the risk estimates that one might make on the basis of the MOH data, even if we only use the averages given in Table 6, and that Dr. Muller’s estimate is toward the low end of this spectrum.Note that if radon exposure is more effective in producing cancer at lower doses, as the evidence indicates, then one would be tempted to rely more heavily on the low-exposure populations of Czechoslovakia and Hiroshima — thereby arriving at a risk estimate two-and-a-half times larger than Dr. Muller’s estimate.
But even this does not fully reflect the risk at low exposure levels, because table 6 is based on average risk values and does not use the low-exposure data from Table 1, Table 2, Table 3, and Table 4. What happens if we take this low-exposure data into account?
CORRECTIONS TO THE MOH ESTIMATES: Probable Lung Cancer Deaths
By definition, 1 WLM is the accumulated exposure of an average adult male individual spending 170 hours in a radon environment of 1 WL.
Exposure to 0.02 WL for one hour per day over a lifetime of 70 years leads to an accumulated exposure of 0.02 x (365 / 170) x 70 = 3 WLM ; over a lifetime of 50 years, the accumulated exposure would be only 2 WLM.
So, for 12 hours per day exposure, the accumulated dose would be 36 WLM for a 70-year life span and 24 WLM for a 50-year life span.
The only purpose of this little calculation is to demonstrate that the persons at risk in homes with a 0.02 WL radon environment will be in the low-exposure, high-risk categories previously identified in the text.
The risk estimates in Table 6 are based on the average risk figures from Table 1, Table 2, Table 3, and Table 4; but those averages systematically underestimate the actual risk to the low exposure groups in each case. If we make the appropriate adjustment to account for the low-dose risk data in the tables, we arrive at the following corrected estimates:
EXHIBIT 10:
Corrected Estimates of the Low Dose Cancer Risk based on MOH Data
Notice that this adjustment brings the three relative risk figures into much closer agreement. (The first entry, based on a different model known as the “absolute risk model”, is not really comparable with the relative risk figures since it is calculated in a different fashion — see note 3 for both Table 1 and Table 2 )
The average number of excess lung cancers per 100,000 given by the relative risk model is therefore 140 — exactly seven times larger than the risk figure cited by Dr. Muller. But this is for only one hour per day exposure; multiplying by 12 and dividing by 100, we get 16.8 excess lung cancer cases per thousand for 12 hours per day exposure. This represents a 31 percent increase over the normal lifetime lung cancer rate for Ontario males (54 per 1000) as given in the MOH Report.
COMMENTS ON THE CALCULATIONS
The risk figures calculated from Table 6 (and subsequently reflected in my corrected estimates) may be wrong for a number of reasons. The method of calculation has both conservative and non-conservative factors built into it. A brief summary of these is given below.
a) Non-Conservative Factors
- The number of excess cancers per WLM may be even greater than indicated by the previous calculations at the low doses and low dose rates which are actually involved. This possibility is suggested by both experimental and epidemiological evidence on alpha-emitters. For example, if we had used the appropriate data (reproduced below) from “Radon Daughter Cancer in Man” (by Victor Archer et al.) as the basis for our calculation, we would have arrived at something like a 45 percent increase in lung cancer as a result of 0.02 WL at 12 hours per day, assuming only a 50-year lifetime. It may be that the MOH data is just too coarse to reveal the true hazard at very low dose rates.
EXHIBIT 11:
Table III from “Radon Daughter Cancer in Man” by Victor Archer et al.
ESTIMATION OF LUNG CANCER RISKS FROM
RADON DAUGHTERS AT DIFFERENT EXPOSURE RATES
Mean Exposure Rate
(in WL)Up to 0.01 0.01 to 0.36 0.36 to 1.09 1.1 to 2.5 2.6 or more Cumulative exposure
(in WLM)Up to 3.0 3.1 to 100 101 to 300 301 to 700 701 or more Attributable cancers
(per year, per WLM,
per million persons)39 34 26 14 4.5 Attributable cancers
(per lifetime, per WLM,
per million persons)1170 1020 780 420 135 Average WLM exposure
needed to produce
one lung cancer835 980 1280 2380 7410 Relative risk factor
per million persons
per WLM of exposure3.1 2.8 2.2 1.2 0.4
- At 12 hours per day exposure, 0.01 WL yields a lifetime dose (over a period of 50 years) of about 12 WLM. Excess cancers, according to this table, would then be 12 times 1170 = 14,040 cases per million, or 14 extra cases per thousand — a 26 percent increase in the Ontario male lung cancer rate.
- At 12 hours per day exposure, 0.02 WL yields a lifetime dose (over a period of 50 years) of about 24 WLM. Excess cancers (using this table) would then be at least 24 times 1020 = 24,480 cases per million, or 24.5 extra cases per thousand — representing a 45 percent increase in the Ontario male lung cancer rate.
a) Non-Conservative Factors (continued)
- Dr. Muller assumes that all lung cancers will appear within a 20 year period following a single exposure (see his comment, reproduced under table 6 on page 27). There is no epidemiological evidence presented to support this assumption. In fact, no less than 11 of the Colorado Plateau miners studied in John Gofman’s paper developed cancer more than 20 years after initial exposure — and this number, 11, is almost double the expected number of lung cancers for the entire population of 1981 miners (using U.S. data on lung cancer incidence in those age groups.) As Victor Archer points out,
“It is not clear how long after start of exposure the incidence of lung cancer continues to increase; certainly no one has yet observed a decrease with increasing time, as has been observed for radiation-induced leukemia” (page 5).
The gradual build-up of long-lived radon daughters in the lung, such as lead-210 with its 21-year half-life, makes it highly unlikely that extra cancers would stop appearing after 20 years. [21] Lead-210 gives rise to polonium-210 as a daughter product; the potent carcinogenic properties of polonium-210 are well documented (see Figure 5).In addition, epidemiological evidence reveals that non-smokers who started mining at an early age are only now beginning to show dramatic increases in lung cancer some 40 or 50 years after initial exposure (“Radon Daughter Cancer in Man”, page 21).
- Children are known to be more radiosensitive than adults. In the late 1960’s, Dr. Alice Stewart showed that a single diagnostic x-ray to the abdomen of a pregnant woman in the first six weeks of pregnancy leads to a 50 percent increase in childhood cancer and leukemia among the offspring [22] — a risk factor which is in turn higher than the relative risk for children up to nine years of age, which is in turn greater than the relative risk for adults (see “The Cancer and Leukemia Consequences of Medical X-Rays”, especially table 1 therein). This extra sensitivity of children to radiation-induced cancers may be compounded by heavy juvenile exposures to radon, as a result of
- children crawling or playing on the floor or close to the walls, where the radon concentrations are often higher than elsewhere in the house;
- children spending more than 12 hours per day inside the house and/or spending more time in the basement;
- children playing outside close to the outer walls of the house, where the radon gas rises from under the house.
- Mothers and invalids may spend much more time indoors than able-bodied men and older children, thus giving rise to proportionately greater doses.
- Mechanical problems or structural deterioration may incapacitate protective systems (such as fans or sealants) within the buildings, resulting in indoor radon levels above 0.02 WL. [23]
- Atmospheric radon gas from uranium tailings in the Elliot Lake area will contribute an outdoor component of radon exposure which is by no means insignificant and which should also be evaluated (see “Health Effects of Radon-222 from Uranium Mining”, which is based on data from the U.S. Environmental Protection Agency). [24]
b) Conservative Factors
- Not all buildings will approach the 0.02 WL limit.Nevertheless, I have been informed that 50 out of 58 new homes recently tested in Elliot Lake showed levels in excess of 0.02 WL before fans were installed to provide extra ventilation. Of a total of 1900 older homes tested in Elliot Lake since 1976, about 325 were found to be over the 0.02 limit. This fraction (1/6) is not very reassuring — if 1/6 of the planned population of 30,000 were exposed to 0.02 WL, we could have over 80 radon induced lung cancer deaths just from breathing radon gas at home.
- For uranium miners, the additional radon exposure in the home will be a relatively small augmentation to the exposure which they receive in the mines.However, the risk is additive, and the ICRP recommends that all unnecessary exposure to radon be avoided.
- Most people will not spend their entire lives in Elliot Lake; there will be a considerable population turnover.Such a turnover of population will not reduce the total number of expected cancers however (even according to the linear hypothesis — see pages 103-105 in The Ham Commission Report). The cancers will just be diluted in a larger population — the human tragedy will be undiminished, but the statistical percentage will look smaller.According to the non-linear hypothesis described in this paper, a turnover in population may actually increase the number of cancers by decreasing the individual exposures without diminishing the total dose to the entire population — thereby bringing about an increased risk per WLM because of the lower individual exposures.
VIOLATION OF CONTROL BOARD GUIDELINESThe Atomic Energy Control Board has laid down annual dose limitations for whole-body exposure, and for various organs of the body.For whole-body exposure to penetrating radiation, AECB limits are 5 rems per year for atomic workers and 500 millirems per year for members of the General public; however, AECB policy is to aim for no more than one percent of the Maximum Permissible Dose of 500 millirems per year as an official guideline — in other words, members of the public should not be exposed to more than 5 millirems per year.
For the lungs, AECB exposure limits are set at 15 rems for atomic workers and 1. 5 rems for members of the general public.
Let us deal with the lungs first.
- Using Dr. Muller’s equivalence of 1 WLM = 4.42 rems (page 5, Appendix, MOH Report), it is easily seen that one year’s accumulated dose at 0.02 WL for 12 hours per day amounts to almost 2.28 rems, which is far in excess of the 1.5 rem limit set by the AECB.
- Even if we use 1 WLM = 4 rems, the annual accumulated exposure at 0.02 WL for 12 hours per day is just over 2 rems, which is 33 percent higher than the maximum permissible exposure for members of the public.
- As the BEIR Commission Report notes, typical conversion factors are 1 WLM = 5 to 6 rems , which makes the situation even worse: see the Ham Commission Report, page 116.
Whole-body exposure results primarily from gamma radiation.
- The MOH Report advocates a standard of 0.05 millirems per hour (gamma) at a height of one metre above the centre of the floor (where your gonads might be when you stand up).
- With 12 hour per day exposure, this will produce an accumulated annual dose of 219 millirems, which is more than 40 times larger than the AECB Guideline of 5 millirems per year.
- Recent standards laid down by the U.S. Environmental Protection Agency limit the exposure of any member of the general public from any U.S. nuclear facility to an absolute maximum of 25 millirems per year.
- Thus, on a 12 hour per day basis, the proposed housing standard of 0.05 millirems per hour will lead to an annual accumulated dose which is 8.76 times higher than the Maximum Permissible Dose from a nuclear facility in the United States.
ESTIMATING THE RISK FROM GAMMA RADIATIONThe health risk from exposure to low level gamma radiation includes not only cancers and genetic defects, but also possible increases in such diseases as diabetes milletus, cardiovascular disease, mental retardation, stroke, hypertension, and a great many infectious diseases. These somatic risks are discussed in some detail in the Proceedings of a Congressional Seminar on Low-Level Ionizing Radiation (Chapter III). Such adverse health effects should definitely be included in any risk assessment associated with setting housing standards for gamma radiation.
There are many well-qualified and well-respected people in the field of health physics or radiation biology who believe that current risk estimates are understated by about a factor of ten. [25] As Dr. Morgan says on page 84 of the Proceedings, “the somatic risks and in particular the risk of radiation-induced cancer of almost every type are more to an order of magnitude [i.e. ten times greater] — than we considered them to be some time back.” A more detailed discussion of the controversy is given in “The Biological Effects of Radiation: Ten Times Worse Than Estimated”.
There is also some evidence which seems to indicate that low dose rates may be more harmful than high dose rates in producing cancer, even in the case of gamma radiation; hut the evidence is quite confused on this subject and I am not able to form a professional judgment as to what the correct risk factor might be (see Proceedings of a Congressional Seminar on Low-Level Ionizing Radiation, Chapter IV). When it is a matter of life and death, however, I believe that the standards must be made as stringent as possible. It is far better to overestimate the risks than to underestimate them — standards can always he relaxed later on, hut dead people cannot be resurrected so easily. Moreover, if the housing standards are tightened up at some future date, it will be very difficult and costly to do the remedial work needed to bring older buildings into conformity with the new standard.
CONCLUSION AND RECOMMENDATIONS
Radon is a very potent carcinogen, mainly because of the radon daughters which inevitably accompany it. Even if we use the linear hypothesis, it has been estimated that about 8 percent of all spontaneous lung cancers in the United States are due to naturally-occurring radon gas, and that is at an average level of exposure (0.001 WL) which is only 1/5 of the proposed housing standard. [26] Allowing a twenty-fold increase in public exposure to such a potent carcinogen seems a very questionable policy. The U.S. Environmental Protection Agency has calculated that outdoor exposure to radon gas emitted by a typical tailings pond, even with five metres of earth covering it, would cause from 60 to 200 extra deaths in the surrounding population per century, due to radon-caused lung cancer (see “Health Effects of Radon-222 from Uranium Mining” for details.)
In this paper, I have argued that
- there is good scientific evidence that alpha radiation is more effective in causing cancer at low dose rates than at high dose rates
- using data provided by the Ministry of Housing, one can reasonably estimate a 31 percent increase in the incidence of lung cancer among people who spend a lifetime in buildings having a 0.02 WL radon environment.
Two recommendations suggest themselves. The first is that people should be told that there is a very real risk of excess lung cancer from radon exposure in homes, and that the proposed housing standard could, under the worst conditions, lead to a substantial increase in lung cancer rates. This may not be a pleasant thing to do, but it must be done. People deserve to know the worst, since they are the ones who will be taking the risks -they certainly deserve more than soothing reassurances which make the problem seem to be non-existent. The second recommendation which I would like to make is that every effort should be made to prevent excess radon in Elliot Lake buildings, if necessary by building them above ground without basements, elevated by means of cinder blocks or other props under the foundations. If all else fails, serious consideration should be given to having workers live away from Elliot Lake and commute to work.
When there is conflicting testimony on the nature of a public health hazard with a high degree of credibility on both sides, it seems to me that the standards should be set on the assumption that the more pessimistic estimate may in fact be the true one. Certainly my training as a mathematician tells me that when this kind of conflicting evidence exists, it can be dangerously misleading to rely on one simplistic mathematical model which incorporates only one narrow view or version of the truth. As Fred Knelman has said, when human life is at stake, the “magic numbers” provided by a calculational model can turn out to be “tragic numbers” for the people involved.
Finis.
BIOGRAPHICAL NOTES
Victor ArcherNow Medical Director at the U.S. National Institute for Occupational Safety and Health, Dr. Archer (MD) has been engaged in studying lung cancer among uranium miners for over twenty years. He worked very closely with J. K. Waggoner (author of the famous Waggoner Report on Uranium Miners in the United States, 1967, which led to a drastic reduction in the maximum permissible radon exposure for U.S. miners in 1971 — from 12 WLM to 4 WLM annually. The Canadian standard of 4 WLM was not adopted until four years later.)Dr. Archer has played a major role in the field of radon carcinogenesis epidemiology. The Ham Commission Report (reference 1) cites six papers co-authored by Dr. Archer out of a total of about twenty papers on the subject.
John Gofman and Arthur Tamplin
In 1963, the U.S. Atomic Energy Commission appointed Dr. Gofman as Assistant Director of the Lawrence Radiation Laboratory in Livermore, California. His mission was to head up a team of experts to investigate the biological effects of radiation on man. After seven years of intensive study of all existing experimental and epidemiological evidence on the subject, Dr. Gofman and his colleague Dr. Tamplin published results which showed that the health effects of radiation were very much higher than official estimates indicated. The research program of Drs. Gofman and Tamplin was terminated not long afterwards, to the mutual dissatisfaction of all parties.
Dr. Gofman is an M.D. and a Ph.D. in nuclear physical chemistry. He is co-discoverer of U-232, U-233, Pa-232, and Pa-233. He is Professor Emeritus in Medical Physics at the Berkeley Campus of the University of California, and Lecturer in Medicine at the San Francisco Campus of the same university. His medical researches are well known; for example, in 1972 he won the Stouffer Prize (one of the most prestigious awards in the field of heart research, carrying a $50,000 cash award) for his work on the role of lipoproteins in arteriosclerosis.
Dr. Tamplin is a Ph.D. in biophysics; he served as a group leader under Dr. Gofman in the Biomedical Division of the Lawrence Radiation Laboratory from 1963 to 1969, when funds for the project were terminated. He is currently a staff scientist at the Natural Resources Defense Council, 917 15th Street NW, Washington DC, 20005.
A world-renowned pioneer in the field of Health Physics, often referred to as “the Father of Health Physics”, Dr. Karl Morgan was Director of the Division of Health Physics at the Oak Ridge National Laboratory for over 30 years. He was one of the original members of the International Commission on Radiological Protection, and was editor of the professional journal Health Physics until quite recently.
In 1971, Dr. Morgan was prevented by his superiors at Oak Ridge from delivering a paper on the health hazards of plutonium (an alpha-emitting transuranic element — see reference 10). That was only one of several instances of suppression of scientific results at Oak Ridge (referred to by Dr. Morgan in reference 8, reprinted here as Exhibit 12). Dr. Morgan left Oak Ridge in 1972 and is now Professor of Health Physics in the School of Nuclear Engineering at the Georgia Institute of Technology.
Alice Stewart and George Kneale
In the 1960’s, Dr. Alice Stewart (MD) did an epidemiological study of childhood cancers and leukemias caused by obstetric x-rays in England. Her work showed that a single x-ray to the abdomen of a pregnant woman during the first six weeks of pregnancy would result in a 50 percent increase in childhood cancer and leukemia among the offspring. She also verified the linear hypothesis for x-rays down to very low doses in the range from 0 to 1.5 rads (low doses, but high dose rates).
When her results were greeted with skepticism, she and her statistician colleague George Kneale undertook a far more ambitious study which took in the entire British Isles. The results of this second study, the largest ever done in the field of radiation carcinogenesis epidemiology up to that time, were printed in Lancet (the British Medical Journal) in 1970. They fully confirmed her earlier findings. A similar study was done by Dr. Brian McMahon of Harvard University using U.S. data, and it gave additional confirmation to Dr. Stewart’s results.
EXHIBIT 12
Letter from Karl Z. Morgan to James Schlesinger
Atlanta, Georgia 30332
(404) 894 3720
May 25, 1977Mr. James Schlesinger
Executive Office of The President
Energy Policy and Planning
Washington, D.C. 20500Dear Mr. Schlesinger:
As a follow-up of my letters of March 30, 1977 and May 23, 1977, and following a lecture I gave recently at the University of Tennessee, in Knoxville, Tennessee, several persons at ORNL have contacted me suggesting that perhaps I would be willing to lend my support to a current ORNL proposal that the LMFBR–CRBR program be continued by replacing the plutonium fuel with uranium-233 and the uranium-238 with thorium-232. I indicated to them that were I to approve such a program, it would be only with a number of qualifications and with assurance of many program changes.
We certainly need information on the thorium/uranium-233 cycle, but I’m not sure this is the cheapest and best way to get the information needed. One of the greatest causes of my trepidation relates to the ORNL management and its past record of blind support of the LMFBR in spite of knowledge of its very serious shortcomings. ORNL management should have been objective and should have insisted on following the best course — not the politically expedient one. Instead, it only did those things that would please the AEC (and later the ERDA). It did not display any vision or desire to be successful — rather, it wanted to preserve status quo, to keep the money rolling, and everyone on the payroll. Any ideas in Oak Ridge contrary to the Washington approved course (prior to my leaving ORNL in 1972) were suppressed. Even studies relating to such important questions as brittle fracture of the reactor containment vessel, common mode failure and emergency core cooling were suppressed, the findings depreciated and not published.
Perhaps management at the various Oak Ridge operations can change this poor record, but I’m not sure it can or that recent events in Oak Ridge would justify our encouragement. For example, when the Mancuso Program (to which I am a consultant) indicated there was an increase on statistical significance in four types of cancer (myeloid neoplasm, breast cancer, pancreatic tumors and lung cancer), Mancuso was informed shortly afterwards that his program would no longer be funded by ERDA, and we learned that Jim Leverman plans to reincarnate this program in Oak Ridge (probably under the supervision of ORAU) to be conducted by Drs. C. C. Lushbaugh and Edith Tompkins. This change could be at a very great cost and would represent a serious discontinuity of scientific effort. One can only suppose that the new Oak Ridge team must get the right answer (i.e. prove there is NO radiation risk to Hanford and Oak Ridge Workers) if it cares to have a continuation of funding. I believe Dr. Lushbaugh would try to be objective, but I have good reason to question if this would be true of Dr. Tompkins.
Perhaps at this stage there is something you can do to prevent this transition, My suggestion would be to ask OSHA to take over the support of this Mancuso program and, hopefully, it would see the wisdom of asking Dr. Mancuso to continue his studies and continue the services of the two British scientists, Drs. Alice Stewart and George Kneale, that have contributed so much to the success, scientific stature, and independent, unbiased evaluation of these data from Hanford and Oak Ridge.
Actually, the cancer risk at Hanford, as reported by Mancuso, Stewart, and Kneale, in comparison with other occupational risks, is rather small. The only problem is that many of the early ORNL, Hanford, and AEC employees have been saying repeatedly in public (and contrary to my cautionary warning) that there are NO radiation risks from work at these facilities. The word NO is such a small number that true scientists retrain from using it. Surely, it is a conflict of interest for this program to be conducted in Oak Ridge under contract with either ERDA or NRC.
I am a strong supporter of nuclear energy, but not at any cost. Many people agree with me that the AEC, NRC, ERDA, ORNL, etc. are often their worst enemies and get in the way of those of us who believe we can build and operate a nuclear energy industry that is acceptably safe and presents occupational and environmental risks that are far less than those of a well conducted fossil fuel power program. After all, the risks from NOx, SOx, COx, hydrocarbons and particulates in terms or lung carcinoma, chronic bronchitis and emphysema are very real and some of us are very concerned about the effects of CO2 on the climate. I am all for Jimmy Carter’s emphasis on conservation, solar and fossil fuel energy for our power, but I believe with your help our country can take the lead in placing nuclear power in its proper place.
In closing, and in contrast with the faults at ORNL and Oak Ridge which I mentioned above, I would like to close with the reminder that some of our country’s best scientists have worked at ORNL and a few of them are still there.
Best personal regards.
Sincerely,
Karl Z. Morgan
Neely Professorcc John F. Ahearne
Acronyms and abbreviations appearing in Dr. Morgan’s letter are explained below:
LIST OF REFERENCES
- “HAM COMMISSION REPORT” — Report of the Royal Commission on the Health and Safety of Workers in Mines, by James M. Ham (Commissioner). Government of Ontario, Toronto, 1976.
- PROCEEDINGS of a Congressional Seminar on Low Level Ionizing Radiation. Environmental Policy Institute, 317 Pennsylvania Ave SE, Washington DC, 20003, July 1977.
- “Radon Daughter Cancer in Man: Factors in Exposure Response Relationships” by V.E. Archer, E.P. Radford, and O. Axelson. Radiation Research 1978 (to appear).
- “The Colorado Plateau: Joachimsthal Revisited? An analysis of the Lung Cancer Problem in Uranium and Hard Rock Miners”, by Arthur R. Tamplin and John W. Gofman. Testimony Presented at Hearings of the Joint Committee on Atomic Energy, 91st Congress of the United States, January 28, 1970.
- “MOH REPORT” — Elliot Lake Protection from Radiation in New Housing. Report to the Environmental Assessment Board by the Ontario Ministry of Housing, with an Appendix by Jan Muller and R. Kusiak. February 1978.
- “The Cancer and Leukemia Consequences of Medical X-Rays” by John W. Gofman. Osteopathic Annals, Nov. 1975.
- “Health Effects of Radon-222 from Uranium Mining”, by Robert O. Pohl. Search, Vol. 7, No. 8, August 1976.
- Letter from Karl Z. Morgan to James Schlesinger, May 25, 1977 (dealing in part with the epidemiological study of cancers in Hanford Workers by Thomas Mancuso, Alice Stewart, and George Kneale) — reproduced in this text as Exhibit 12.
- “The Biological Effects of Radiation: Ten Times Worse Than Estimated”, by Arthur R. Tamplin. Natural Resources Defense Council, 917 15th Street NW, Washington DC, 20005, August 1977.
- “The Plutonium Controversy”, by John W. Gofman. Journal of the American Medical Association, Vol. 236, July 19, 1976.
- Mathematics in Today’s World, edited by Gordon Edwards, Science Council of Canada, Ottawa, 1974. Limited edition. Copies available in all university libraries in Canada.
GLOSSARY
Although it is not necessary to understand all of the technical jargon in order to understand the problem of radon gas in buildings, here is a set of explanations which you can refer to if you wish. Don’t use it unless you feel you have to.
Radioactivity is the property of certain atoms (which are not stable) to spontaneously disintegrate by emitting either energetic particles or rays of pure energy (or both) from the nucleus or centre of the atom.
The half-life of a radioactive substance is the time required for half of its atoms to disintegrate.
The daughters of a radioactive substance are the other substances which are created as byproducts in the process of radioactive disintegration; in many cases, the daughters of a radioactive substance are also radioactive.
Ionizing Radiation is the term used to describe the various energy forms which can be emitted by the disintegration of radioactive atoms; these include
- energetic particles — alpha, beta, and neutrons
- rays of pure energy — gamma rays and x-rays
Exposure to even low levels of ionizing radiation can cause cancer and/or genetically defective children in the exposed population. These effects are caused by sub-microscopic damage to the cells of the body which causes some of them to reproduce in an abnormal fashion.
Gamma Radiation ( ) is the most penetrating of all forms of ionizing radiation, capable of penetrating thick layers of metal; it is given off by the radioactive disintegration of such substances as radium-226, and is similar in nature to x-rays. (Radium-226 is primarily an alpha-emitter, however.)
Beta Radiation ( ) is the next most penetrating form of ionizing radiation after x-rays and-gamma rays; it actually consists of high velocity particles called beta particles or electrons.
Alpha Radiation ( ) is the least penetrating form of ionizing radiation, unable to penetrate through a sheet of paper; it consists of high velocity particles (called alpha particles) which are more than 7000 times heavier than electrons.
Linear Energy Transfer (LET) measures the relative amount of damage done by a particular type of radiation per unit distance travelled. It is inversely related to the penetrating power, but not in a simple way. The most penetrating types of radiation (gamma, x, beta) are referred to as “low LET radiation”, while the least penetrating types (alpha, neutrons) are called “high LET radiation”. High LET radiation is far more damaging per unit dose than low LET radiation.
A curie (Ci) is a measure of radioactivity in disintegrations per second; one curie corresponds to the radioactivity in a gram of pure radium.
A picocurie (pCi) is a trillionth (i.e. a millionth of a millionth) of a curie.
Radon is an alpha-emitting radioactive gas with a half-life of 3.8 days. It is a daughter of radium-226; and it gives rise to other radioactive substances known as radon daughters, most of which are also alpha-emitting substances.
One working level (WL) designates a concentration of 100 picocuries of radon daughters per litre of air (abbreviated as 100 pCi per l)
A working level month (WLM) is a measure of human exposure to radon daughters. One WLM is equal to the concentration of radon daughters, measured in working levels, times the number of hours of exposure, divided by 170. Thus a man exposed to 1 WL for 170 hours (approximately one month’s exposure at 40 hours per week) will accumulate an exposure of 1 WLM.
A rad (“radiation absorbed dose”) is a measure of how much energy is absorbed by tissue when exposed to a certain source of ionizing radiation. Technically, 1 rad corresponds to 100 ergs of energy being absorbed in each gram of tissue exposed to ionizing radiation.
A rem (“radiation equivalent man”)is a measure of the ability of a given dose of radiation to do harm to living cells (thereby causing a predictable increase in cancer, or in genetic defects to the children of people whose gonads have been exposed to ionizing radiation). For low LET radiation, 1 rem corresponds almost exactly with 1 rad of exposure; but for high LET radiation, each rad of exposure corresponds to 10 or 20 rems, because of the much greater relative damage which is done to living cells by high LET radiation.
A millirem (mr) is a thousandth of a rem. The natural background radiation to which we are all exposed as a result of cosmic radiation from outer space and naturally occurring radioactive substances is about 100 millirem per year, or about 0.01 millirem per hour.
The quality factor associated with a given type of radiation is the factor which must be used to convert a radiation dose measured in rads to the equivalent number of rems. For gamma radiation, the quality factor is 1 (1 rad = 1 rem), but for alpha radiation, the quality factor is about 20 (1 rad = 20 rems).
The linear hypothesis states that the extra cancers and genetic defects that will occur in a given population as a result of exposure to ionizing radiation is directly proportional to the sum total of all of the individual doses received by all the members of the population.
NOTES
- The shortest distance between two points on a sphere is not a straight line, but a “great circle” — that is, a circle which has the same radius as the sphere itself. However, if a “line” is defined as the shortest distance between two points, then these great circles are in fact “lines” on the surface of the sphere, since they do represent the shortest possible paths joining points on a sphere. The technical term for such a curved “line” is “geodesic”. By definition, a geodesic is any path on a curved surface which provides the shortest distance between any two neighbouring points along the path.
- Other changes of behaviour are, of course, possible. A culture of bacteria will often grow exponentially until it exhausts its food supply, whereupon it will suffer a sudden catastrophic collapse. In other cases, where there are predator-prey relationships at work, a cyclic rise and fall of animal populations is frequently observed. However, when a species of bird or mammal is free from serious competition or predation, the logistical growth model seems to offer a good description of what happens in a natural setting.
- Consider the following words by Dr. Donald Miller, Head of Biomathematics at the Canadian National Research Council, addressing a senior seminar of applied mathematicians in Ottawa on March 5 1974: (Reference 11, pages 160-162)
“Are … people satisfied with the results of mathematical modelling? … I think generally that they are not satisfied when the problems involve very complicated systems — as they invariably do in ecological studies, in regional planning, and in studies of pollution or energy supply. I recently heard the former director of the Marion Lake Project, one of Canada’s contributions to the International Biological Programme, make the comment that he was not convinced that mathematical modelling was any help at all in the study of ecological systems….
“In many such projects, not enough care is devoted to the formulation and testing of the mathematical description. In its most fundamental terms, this means that we, the mathematical community, might have forgotten something that we should have learned many years ago, under the heading of the scientific method. We all know how that goes; one looks at a system and inductively frames a hypothesis, deductively works out the consequences of this hypothesis in a form that can be tested, experimentally tries to verify or disprove the hypothesis, and returns to frame a new hypothesis on an improved basis. This seems simple enough, and most people in this audience, I’m sure, are feeling a bit insulted. But the fact is that we do not seem to be doing it. We are not following the basic philosophy of science.” (Emphasis added)
- These Proceedings are 360 (plus xxv) pages long. The bulk of the text is actually an anthology of about forty short papers which were specially prepared by the participants. Each of these papers deals in considerable detail with specific applications of mathematical methods to real-life problems arising in Federal Government Departments in Ottawa, using an absolute minimum of technical jargon and no intimidating mathematical symbolism. The Proceedings have also been translated into German and distributed by the West German Government.
- There is an impressive list of references provided by the Ham Commission Report (our reference 1), but they are limited to the study of uranium miners. It is perhaps worth noting, in another context, that the two most potent carcinogens in tobacco smoke are now known to be benzopyrene (a cancer causing aromatic hydrocarbon which is also present in automobile exhaust) and polonium-210 (one of the more persistent radon daughters).As already remarked in the summary (page iii), phosphate ore is relatively rich in uranium. As a result, radon gas is slowly released from the phosphate fertilizer which is used on most tobacco crops. Being heavy, the gas accumulates somewhat before dissipating, and the short-lived radon daughters (which carry an electrical charge) promptly attach themselves to microscopic dust particles. These dust particles, in turn, adhere to the sticky, resinous hairs which grow on the underside of the tobacco leaves. These short-lived daughters will all disintegrate within a few hours after being formed, leaving a deposit of the radioactive substance lead-210 (with a half-life of 21 years) in the tobacco leaves.When the tobacco leaves are harvested, cured, shredded, rolled into cigarettes, and sold in the stores, they still carry a burden of lead-210 with them. Polonium-210 is a radioactive daughter of lead-210, and, like its parent, it is a solid at normal temperatures. However, when a smoker draws on his or her cigarette, the intense localized heat at the burning tip of the cigarette is enough to volatilize both substances. Thus the chronic smoker ends up with a deposit of lead-210 and polonium-210 in his or her lungs.For evidence on the carcinogenicity of polonium-210, see the reference cited in Figure 5 on page 16. For more information on this topic, and for further references, see “Tobacco Radioactivity and Cancer in Smokers” by Edward A. Martell, in American Scientist, volume 63, July-August 1975, pp. 404-412. Dr. Martell has been a staff member at the National Centre for Atmospheric Research in Boulder, Colorado for many years, and has written widely on the subject of radioecology.
- As far as medical science can tell, carcinogens act directly on the nucleus of the cell, causing random damage to the chromosomes and DNA molecules contained therein. Most of the cells so damaged are either killed or sterilized. However, in a very few cases, one of these damaged cells may survive the injury and still be capable of reproducing. Such a cell may become a cancerous cell, if it begins to proliferate in an undifferentiated or “cancerous” manner. On the other hand, if a reproductive cell is damaged in this way, it can lead to genetic deficiencies in the offspring — and if an embryonic cell is so affected, the normal development of the fetus can be disrupted. For this reason, it is recognized that substances having a carcinogenic effect will also have a genetic and a teratogenic effect. It is also widely believed that since these effects take place in a random manner at the cellular level, there is no such thing as a “harmless” dose. Any individual dose, however small, is able to produce gross malignancies and deformities if it is administered to a sufficiently large population.Consider the following quotations from the Proceedings of a Public Forum on Policies and Poisons held in Toronto, on November 15 1977, under the auspices of the Science Council of Canada and the Canadian Public Health Association:”… there is good circumstantial evidence that 80 percent of human cancers are environmental in origin….” (page 11)”There are occasions when it is known that there are severe risks attendant upon exposure to certain substances and yet no action to control them is undertaken. This appears to be a sort of ‘paralysis by analysis’. For example, the risks associated with both asbestos and radiation were well-known to the medical profession in the 1930’s, and yet no preventive or regulatory action appears to have been taken.” (page 15J”The National Institute of Occupational Safety and Health’s position … is that ‘excessive cancer risks have been demonstrated in all fiber concentration studies to date. Evaluation of all available human data provides no evidence for a threshold or for a safe level of asbestos exposure’,” (Page 21)
“It is necessary that we should strive for as near zero risk in the workplace as is technologically possible to achieve. For known carcinogens the level of exposure should be zero. For non-carcinogenic agents the level of permissible exposure should be revised downwards from that point at which there are gross effects on society.” (pages 17-19)
- The sum total of all the doses administered to the population is also called the “integrated dose”. According to the linear hypothesis, this “integrated dose” is proportional to the total number of damaged cells, of which a certain fraction will become cancerous. Thus the number of cancers can be predicted once the integrated dose is known.
- This straight-line relationship between integrated dose and cancers is called a linear relationship; hence the name for the linear hypothesis. (See note 16 please!)
- Dr. Morgan is an esteemed member of the Health Physics community. He is one of the founding members of the International Commission on Radiological Protection, and is today the only emeritus member of that Commission: see also the biographical sketch given earlier.
- Dr. Morgan has written an excellent article entitled “Cancer and Low Level Ionizing Radiation” in the September 1978 issue of the Bulletin of the Atomic Scientists (pp. 30-41). In this article, Dr. Morgan reviews recent medical evidence which shows not only that the threshold theory is probably wrong, but also that “the cancer risk from exposure to ionizing radiation is much greater than was thought to be the case some years ago.” He then gives six documented arguments to show why even the linear hypothesis may consistently underestimate the carcinogenic powers of radiation at low levels. Immediately following the Morgan article, in the same issue of the same magazine, is another entitled “The Risks for Radiation Workers”, written by Joseph Rotblat. It is also well worth reading, and much to the same effect.
- Plutonium-239 is one of the most well-known examples of an alpha emitter. Since the radiation from plutonium has little penetrating power, plutonium can be stolen and transported with relative ease. However, when inhaled into the lungs, it is extraordinarily toxic. A barely visible speck of plutonium weighing only a few thousandths of a gram can, if inhaled into the lungs, cause death within hours by massive fibrosis of the lungs. An invisible speck of plutonium only a few thousandths of one thousandth of a gram (in other words, a few micrograms), if inhaled into the lungs, may cause a fatal lung cancer to develop many years or even decades after exposure, with almost 100 percent certainty. See the article by Dr. John Edsall, Professor Emeritus of Biochemistry at Harvard University, entitled “Toxicity of Plutonium and Some Other Actinides” -Bulletin of the Atomic Scientists, September, 1976.
- Once alpha emitters are inside the body, they cannot be detected by any external instruments. The degree of internal contamination can only be inferred by such things as urine analysis and sputum analysis, which give only crude results.
- Neutron radiation, like alpha radiation, is also more effective in causing cancer than either beta or gamma radiation. Although the same amount of energy will be delivered to the tissues by a given dose of radiation, no matter whether it is made up of neutrons, alpha particles, beta particles, or gamma rays, it is known that a higher density of ionization is caused by alpha particles and neutrons than by the other types of ionizing radiation. Higher density of ionization means that more chemical bonds can be broken, and therefore greater biological damage can be done, per gram of tissue exposed. See “linear energy transfer”, “rad”, “rem”, and “quality factor” in the glossary (pages 43-44).
- Several hypotheses have been advanced to explain why this should be so, but none of them has been thoroughly tested. According to one theory, there is overkill at high doses (cells which would have developed into cancer cells are instead killed by the high dosage) and therefore, at low doses, more cancer is observed per unit dose. Another theory is that the cell membrane is more effectively damaged at low dose rates than at high dose rates, thereby allowing other carcinogens (such as chemical carcinogens) easier access to the nucleus. (If this theory is correct, then not only alpha radiation but all forms of ionizing radiation should be more effective in causing cancer at low dose rates.) Still other theories deal with the distribution of alpha emitters inside the body; if a “warm particle” or a “hot particle” is lodged in the lung, it is believed by some that such a particle may be more effective in causing cancer than if the same total dose were evenly distributed throughout the lung. But all of these theories are conjectural, and so we will limit ourselves to discussing the experimental and epidemiological evidence which indicated that more cancer is observed per unit dose at low dose rates of alpha exposure, whatever the reason for that might be,
- See reference 2, as well as exhibits 1 and 2 on pages 9 and 10.
- Since this was written, I have received a list of 12 references from Bob Wilson, Director of the Health and Safety Division of Ontario Hydro, which are supposed to provide evidence indicating that the linear hypothesis is conservative for low level alpha radiation. Although I have not yet had time to do a thorough review of all of these papers, it is clear that some of them do not suggest a different conclusion from that stated in the text.For example, the very first reference given by Mr. Wilson is the famous paper by Sevc, Kunz and Placek, which appeared in Health Physics in June of 1976, entitled “Lung Cancer in Uranium Miners and Long Term Exposure to Radon Daughter Products”. In the concluding paragraph of that paper, the authors state that “the estimate of risk of low doses, obtained by means of linear extrapolation of the relationship between higher doses and effect in a heterogeneous population, need not under all conditions represent the maximum possible risk.” In other words, the linear hypothesis may not be conservative at low doses.Mr. Wilson also cites “Sources and Effects of Ionizing Radiation”, the 1977 report of the United Nations Scientific Committee on the Effects of Atomic Radiation (UNSCEAR). Annex G of the UNSCEAR Report entitled “Radiation Carcinogenesis in Man” lists three studies which are supposed to confirm the conservatism of the linear hypothesis for low level alpha radiation. The first study is the paper by Sevc, Kunz, and Placek just referred to. The second is co-authored by Dr. Victor Archer, who has since changed his mind about the linear hypothesis as a result of more detailed analysis of all the existing evidence. The third study is my reference 1, the Ham Commission Report, which states: “This analysis is most emphatically not offered as the basis for any estimate of risk per unit dose. . . . [which would be a trivial task if the Linear hypothesis were true]. It should also be possible . . . to accommodate the idea of a response more than proportional to cumulative dose.” (from Appendix C, “Radiogenic Lung Cancer in Uranium Miners 1955-74”). Thus none of the three UNSCEAR references indicates an unqualified confirmation of the linear hypothesis, and indeed at least two of them explicitly include the possibility of non-linearity at low doses.
- For more information about Dr. Archer, see the biographical notes.
- For more information about Dr. Gofman, see the biographical notes. The data on which Dr. Gofman bases his calculations are the same as those used in the Ontario Ministry of Housing’s Table 1 and Table 2.
- “It is generally assumed that the risk of radiation induced cancer is proportional to the exposure and that there is no absolutely safe threshold below which the risk is zero. It should be borne in mind, however, that no direct proof of carcinogenic effect, at extremely low doses, exists at this time so the assumption of “no threshold” is conservative ” (MOH Report, reference 5, page 5)It is indeed strange that the Ministry of Housing should consider that no evidence provides a proof of conservatism, especially since, in Appendix C of the Ham Commission Report (reference 1) the threshold hypothesis is tested and “easily discredited” on solid statistical grounds. The report then goes on to say:
“The possibility of a ‘safe’ threshold dose cannot be excluded by these, or any other finite amount of data. However, further analyses, to be reported in full elsewhere, have shown that, to be at all plausible in relation to the Ontario experience, a postulated threshold would have to be lower than 10 WLM.”
This is not very encouraging to those who still believe in a safe threshold!
- According to Dr. Muller’s analysis (in reference 5), the volume of air inhaled daily by men and women was obtained from ICRP Publication 26, as was pertinent data on the mass of the male and female lungs at different ages. It was also assumed that the retained fraction of radon daughters in the lungs was 70 percent, that there is no biological effect during the first five years of exposure to radiation, and that all radiation-induced deaths occur within 25 years of initial exposure. Nevertheless, the details of his calculation are very fuzzy, and his results are extraordinarily low. For example, the female mortality figures calculated by Dr. Muller are less than half as large as the ICRP estimates, and the loss of life expectancy for females is also far lower (less than a quarter, in most cases) than the ICRP estimates, as can be seen from MOH Table 6. Why should there be such a wide discrepancy ?
- See note 5 regarding lead-210 and polonium-210 in tobacco smoke.
- For more information on Dr. Stewart, see the biographical notes. Her completed work was published as “Radiation Dose Effects in Relation to Obstetric X-Pays and Childhood Cancer” in Lancet 1185 (June 5, 1970).The findings of her very ambitious epidemiological studies have been confirmed by other studies done by Dr. Brian McMahon of Harvard University (“X-Ray Exposure and Malignancy”, Journal of the American Medical Association, v. 183, 1963) and Dr. Irwin Bross of the Roswell Park Memorial Institute for Cancer Research in Buffalo (“Leukemia from Low-Level Radiation”, New England Journal of Medicine, v. 287, 1972). Dr. Bross’ results come from a study of 13 million human beings in three states; an updated account of his findings can be found in reference 2.More recently, Dr. Stewart and her statistician colleague George Kneale have assisted Dr. Thomas Mancuso in studying the cancer incidence among workers at the Hanford Plutonium Works in Washington State. The results of this study have appeared as “Radiation Exposures of Hanford Workers Dying from Cancer and Other Causes” in Health Physics, 33, 1977.Using statistics on over 24,000 ex-employees at the Hanford nuclear facility, the authors (Mancuso, Stewart, and Kneale) have shown that as small a dose as 12.2 rads accumulated radiation exposure could lead to a doubling of the normal incidence of most cancers. According to the study, for cancers of the pancreas or lung, the “doubling dose” may be as low as 6.1 rads, and for cancers of bone marrow, the “doubling dose” is less than 2.5 rads. These latter cancers, it is worth noting, are often induced by alpha emitters such as plutonium, or radon daughters, or radium.It is a sad commentary that both Dr. Bross’ funding and Dr. Mancuso’s funding hare been terminated, so that these men are unable to complete the investigations which they have begun. In a similar way, the around-breaking work of Gofman and Tamplin was terminated back in the late 1960’s with much acrimony. I have included as an exhibit a revealing letter, written by Dr. Karl Morgan to James Schlesinger on May 25 1977, concerning the “biopolitics” which seems to be at work in suppressing scientific researches which do not conform to the official dogma that radiation is relatively harmless at low doses.
Dr. Morgan’s letter appears as Exhibit 12.
- Testimony given at the Elliot Lake Environmental Assessment Hearings indicated that any gouges in the sealant (caused perhaps by children playing roughly, or by men sliding heavy furniture over the floor) would allow almost as much radon gas into the basement as if there were no sealant whatsoever.The situation is made even worse by the fact that radiation is not perceptible to any of our senses, and most homeowners cannot make measurements of the radon gas levels in their own homes. Thus there could be serious deterioration of the protective systems, which could go undetected for a very long time.
- In 1973, the U.S. Environmental Protection Agency published a substantial report entitled “Environmental Analysis of the Uranium Fuel Cycle”, EPA-520/9-73-003-B. According to the Report, about 200 extra lung cancer deaths per century could be expected to occur among members of the general population as a result of the radon gas emissions from a typical uranium tailing pile (assuming that only 5 percent of the radon gas produced actually escapes into the atmosphere, and assuming that population does not grow at all).Dr. Pohl’s article simply takes the E.P.A. figures and converts them into a figure which represents the number of extra deaths that one could expect in the long run per 1000 megawatt-years of nuclear electricity produced. The number he comes up with is 396 extra deaths per gigawatt year of nuclear electricity, which is far in excess of the number of deaths usually attributed to an equivalent coal-burning plant. It is worth noting that both the E.P.A. figures and Dr. Pohl’s figures are based on the linear hypothesis. If the linear hypothesis underestimates the actual risk by a factor of ten or thereabouts, as argued in this paper, then the actual health effects of uranium tailings may be far worse than anyone has yet reckoned.
- See the articles by Morgan and Rotblat mentioned in note 10. See also the Proceedings of the Congressional Seminar on Low Level Ionizing Radiation, reference 1.
[ Estimating Lung Cancers: Part 2 ]


